Production-Ready Self-Hosted Setup Guide
This guide provides comprehensive instructions for deploying Logwise in a production environment with enterprise-grade non-functional requirements. The architecture is designed to be horizontally scalable, highly available, fault-tolerant, and performant.
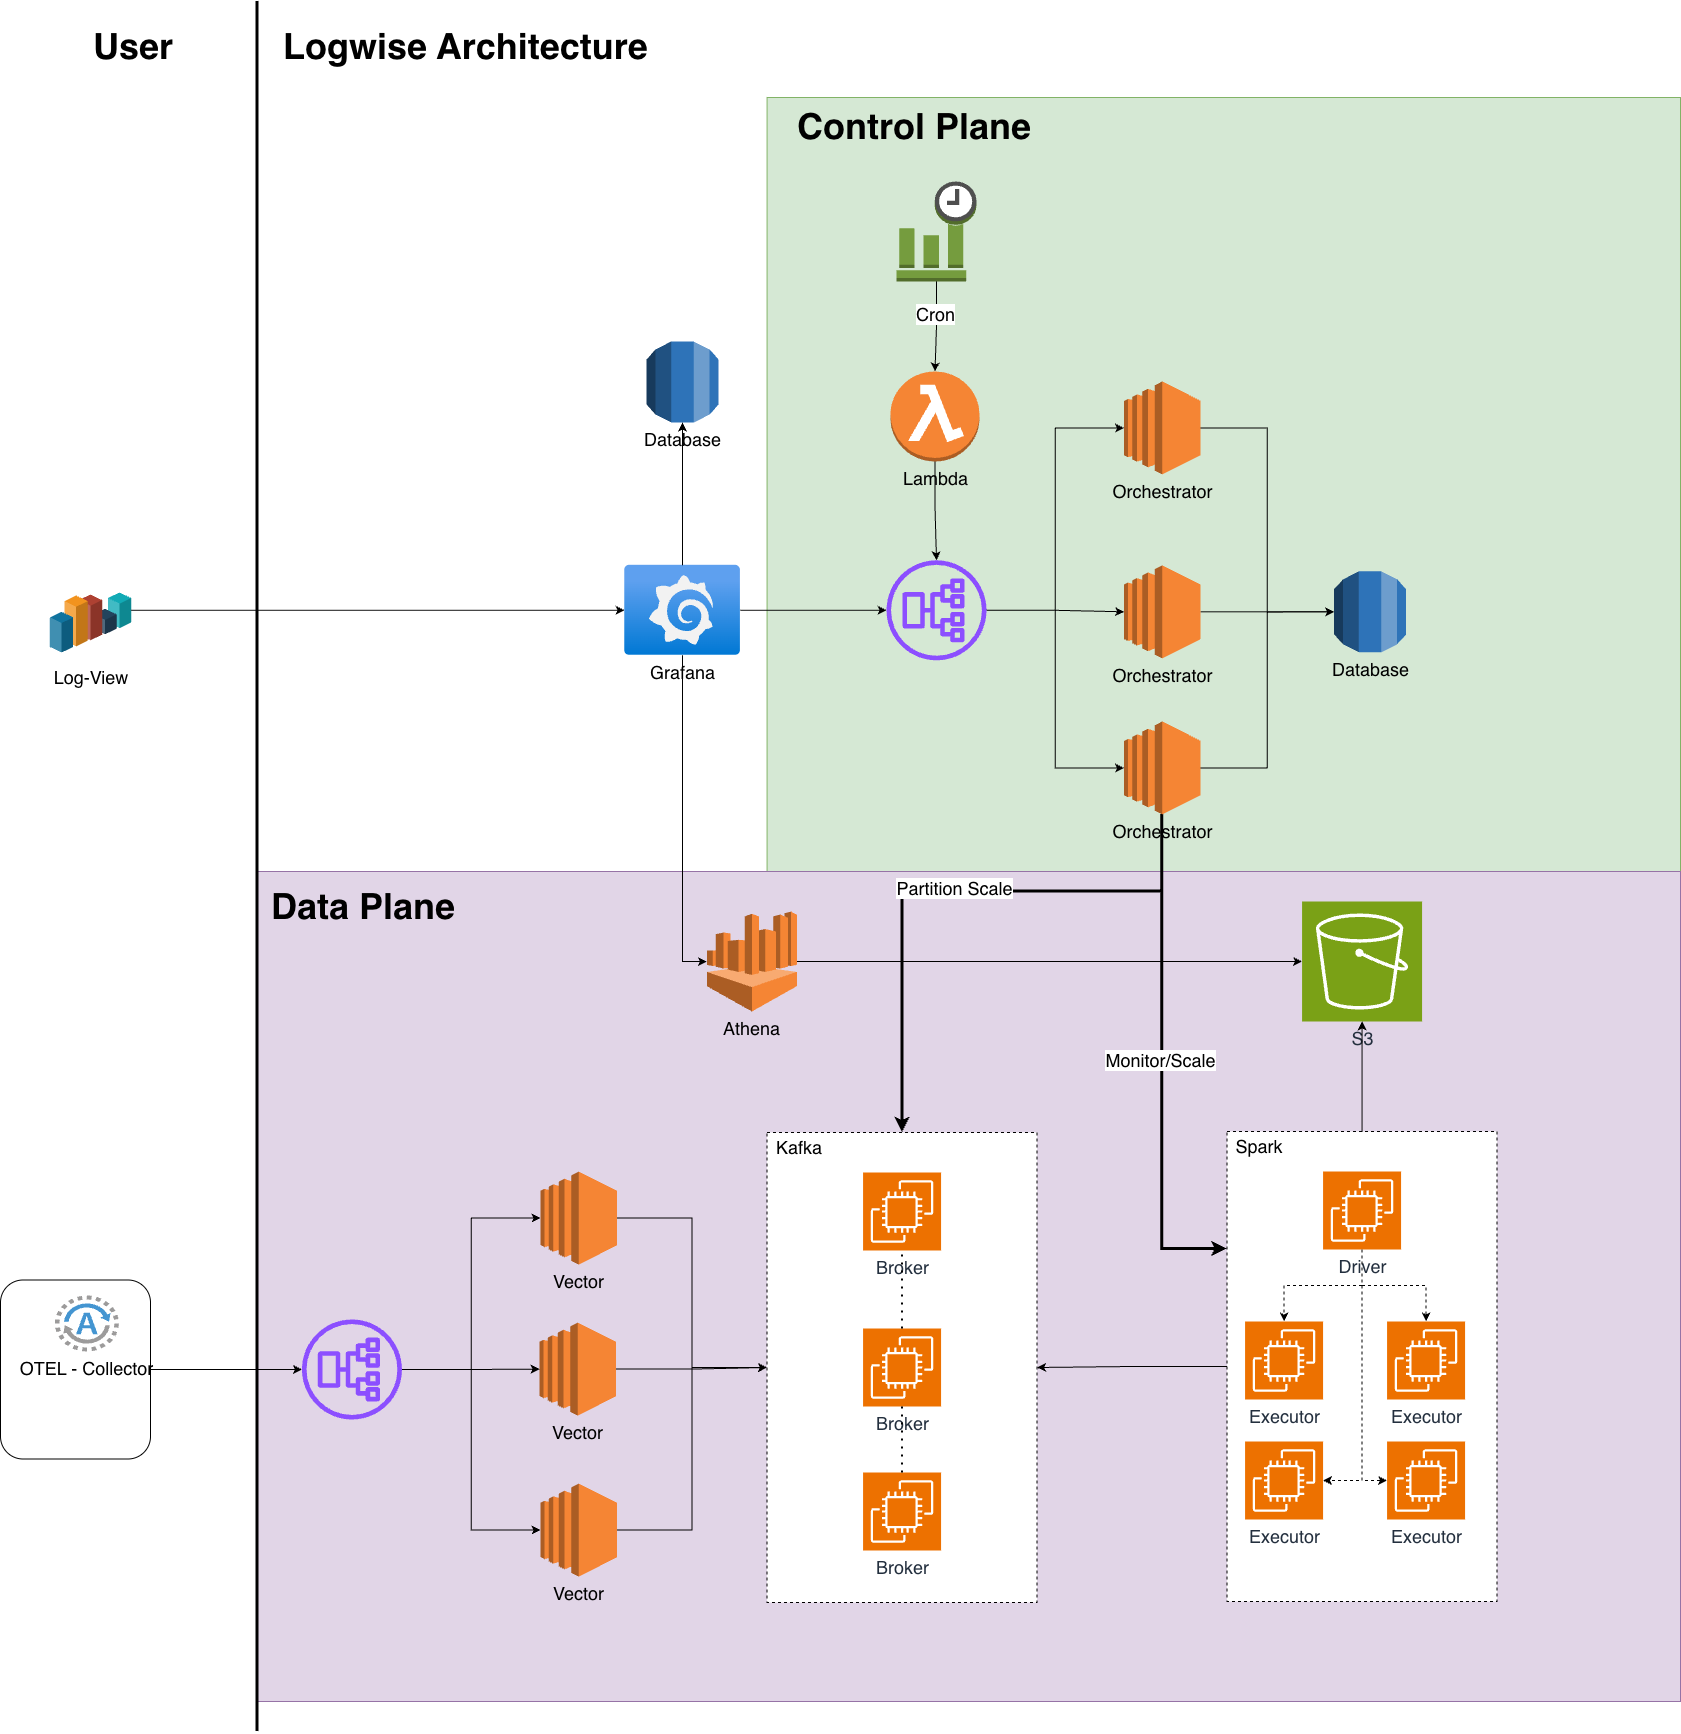
Architecture Overview
Logwise is architected as a two-plane system that separates control and orchestration from data processing:
Control Plane – Orchestrator services that monitor workloads, manage capacity, and ensure system health (Spark workers, Kafka partitions, etc.).
Data Plane – Handles log ingestion, processing, storage, and querying at scale.
Control Plane Components
1. Event Scheduler (Cron / EventBridge)
- Purpose: Periodically triggers orchestration cycles for continuous monitoring and scaling decisions.
- Configuration: Set up scheduled triggers (recommended: every 1-5 minutes) to invoke the Orchestrator API.
- High Availability: Use managed services (AWS EventBridge, CloudWatch Events) for automatic failover.
2. Scheduler Function (Lambda)
- Purpose: Serverless function that invokes the Orchestrator HTTP API on schedule.
- Benefits: Fully managed, highly available, and cost-effective for periodic invocations.
- Configuration: Configure Lambda with appropriate timeout and retry policies.
3. Load Balancer (Orchestrator)
- Purpose: Provides a stable, highly available endpoint for the Orchestrator API.
- Configuration: Use Application Load Balancer (ALB) or Network Load Balancer (NLB) with health checks.
- Health Checks: Configure to monitor
/healthcheckendpoint.
4. Auto Scaling Group (Orchestrator)
- Purpose: Runs stateless Orchestrator instances behind the load balancer for horizontal scalability.
- Scaling Policy: Scale based on CPU utilization, request count, or custom metrics.
- Minimum Instances: Deploy at least 2 instances for high availability.
- Configuration: Ensure instances are distributed across multiple availability zones.
5. Orchestrator Database (RDS / MySQL)
- Purpose: Highly available, multi-AZ relational store for configuration, stage history, and scaling state.
- Configuration:
- Enable Multi-AZ deployment for automatic failover
- Configure automated backups with point-in-time recovery
- Set appropriate instance size based on expected metadata volume
- Data Stored: Service metadata, Spark job history, scaling decisions, retention policies.
Data Plane Components
1. Vector Auto Scaling Group + Load Balancer
- Purpose: Log ingestion layer that scales with traffic while exposing a single stable endpoint.
- Configuration:
- Deploy Vector instances in an Auto Scaling Group
- Place Application Load Balancer in front to distribute incoming log traffic
- Configure health checks on Vector's API endpoint (default: port 8686)
- Scaling: Scale based on incoming log volume, CPU, or memory utilization.
- Endpoint: OTEL Collectors and other log sources send to the Vector load balancer endpoint.
2. Kafka Cluster
- Purpose: High-throughput, fault-tolerant message broker that buffers logs for downstream processing.
- Configuration:
- Deploy as an N-broker cluster (minimum 3 brokers recommended)
- Set replication factor to 3 for fault tolerance
- Configure topics with appropriate partition counts (default: 3 partitions per topic)
- Set retention period based on requirements (default: 1 hour)
- Fault Tolerance: With replication factor 3, the system tolerates up to 2 broker failures without data loss.
- Scaling: Add brokers horizontally; Orchestrator can dynamically adjust partition counts.
3. Spark Master + Auto Scaling Group of Spark Workers
- Purpose: Distributed processing engine that transforms logs from Kafka into Parquet format for efficient storage.
- Configuration:
- Deploy Spark Master as a stable, highly available service
- Deploy Spark Workers in an Auto Scaling Group
- Configure Spark Master with appropriate resources
- Auto-Scaling: The Orchestrator monitors Kafka backlog and automatically scales Spark workers based on:
- Kafka consumer lag
- Incoming log volume
- Processing throughput metrics
- Fault Tolerance: Spark Master automatically reassigns work to healthy workers if a worker fails.
4. Amazon S3
- Purpose: Durable, virtually unlimited object storage for long-term log retention.
- Configuration:
- Create S3 bucket with versioning enabled (optional, for compliance)
- Configure lifecycle policies for cost optimization
- Set up appropriate IAM policies for Spark and Orchestrator access
- Retention Management: Retention policies are managed by Orchestrator based on:
- Retention settings stored in Orchestrator DB
- Default config for non-production environments
- S3 lifecycle policies for automatic archival/deletion
5. AWS Glue + Athena
- Purpose: Schema management and serverless SQL query layer over S3 data.
- Configuration:
- Glue: Manages table schemas and partitions over S3 data
- Athena: Provides serverless SQL queries without capacity planning
- Benefits: Highly available, pay-per-query pricing, automatic scaling.
6. Grafana Auto Scaling Group + Load Balancer + Grafana DB (RDS)
- Purpose: Scalable, highly available dashboards for log viewing and analytics.
- Configuration:
- Deploy Grafana instances in an Auto Scaling Group
- Place Application Load Balancer in front for high availability
- Configure Grafana to use RDS for dashboard and metadata storage
- Data Sources:
- Athena datasource for querying S3 logs
- Orchestrator DB for metadata and service information
Non-Functional Requirements & How They're Addressed
This section explains how Logwise architecture addresses critical non-functional requirements for production deployments.
1. Scalability (Horizontal Scaling)
Requirement: System must handle increasing log volumes without performance degradation.
How It's Achieved:
- Vector: Auto Scaling Group scales instances based on incoming log volume. Load balancer distributes traffic across all healthy instances.
- Kafka: Horizontal scaling by adding brokers. Topics can be partitioned across brokers for parallel processing. Orchestrator can dynamically adjust partition counts based on throughput needs.
- Spark: Auto Scaling Group of workers scales based on Kafka backlog and processing requirements. Orchestrator monitors metrics and scales workers up/down automatically.
- Orchestrator: Stateless design allows horizontal scaling. Multiple instances behind a load balancer share the orchestration workload.
- Grafana: Auto Scaling Group ensures dashboard availability scales with user traffic.
Key Metrics Monitored:
- Kafka consumer lag
- Vector CPU/memory utilization
- Spark processing throughput
- Request latency at load balancers
2. High Availability (HA)
Requirement: System must remain operational even when individual components fail.
How It's Achieved:
- Multiple Instances: All critical components (Orchestrator, Vector, Kafka brokers, Spark workers, Grafana) run in multiple instances across availability zones.
- Load Balancers: Provide single stable endpoints while routing traffic to healthy instances. Automatic health checks remove unhealthy instances from rotation.
- Kafka Replication: With replication factor of 3, data is replicated across 3 brokers. System tolerates up to 2 broker failures without data loss.
- Multi-AZ Databases: RDS instances configured with Multi-AZ deployment provide automatic failover (typically < 60 seconds).
- Spark Master HA: Spark Master can be configured in HA mode with ZooKeeper for automatic failover.
- S3 Durability: 99.999999999% (11 nines) durability ensures data is never lost.
Failover Scenarios:
- Orchestrator failure: Load balancer routes to healthy instances. Stateless design means no session loss.
- Vector instance failure: Load balancer removes failed instance. Remaining instances continue processing.
- Kafka broker failure: Replicated partitions on other brokers continue serving data. No data loss with replication factor ≥ 2.
- Spark worker failure: Spark Master automatically reassigns tasks to healthy workers. Checkpointing ensures no data loss.
- Database failure: Multi-AZ RDS automatically fails over to standby instance.
3. Fault Tolerance & Resilience
Requirement: System must automatically recover from failures and continue operating.
How It's Achieved:
Automated Monitoring: Orchestrator continuously monitors component health:
- Polls Spark Master every 15 seconds to check driver status
- Automatically submits Spark jobs if driver is not running
- Monitors Kafka cluster health and partition status
- Tracks log sync delays to detect processing issues
Automatic Recovery:
- Spark Jobs: Orchestrator automatically detects failed Spark drivers and resubmits jobs. Handles state cleanup and recovery scenarios.
- Health Checks: All components expose health check endpoints. Load balancers and orchestrators use these to detect and route around failures.
- Kafka Consumer Groups: Spark consumers automatically rebalance when brokers or partitions change.
Data Durability:
- Kafka: Replicated partitions ensure data survives broker failures. Committed messages are never lost.
- S3: All processed logs are durably stored. Even if processing fails, raw logs remain in Kafka (based on retention) for reprocessing.
- Checkpointing: Spark checkpoints processing state to S3, enabling recovery from failures.
Graceful Degradation: System continues operating with reduced capacity during partial failures (e.g., fewer Spark workers process at lower throughput).
4. Performance & Throughput
Requirement: System must process high volumes of logs with low latency.
How It's Achieved:
Distributed Processing:
- Kafka partitions enable parallel consumption by multiple Spark executors
- Spark processes logs in parallel across multiple workers
- Vector instances process logs concurrently
Efficient Data Formats:
- Protobuf: Vector converts logs to protobuf format, reducing bandwidth and storage by 30-50%
- Parquet: Spark converts logs to Parquet format, providing:
- Columnar storage for efficient queries
- Compression (typically 80-90% size reduction)
- Predicate pushdown for faster filtering
Buffering & Batching:
- Kafka buffers logs, allowing downstream processing to batch efficiently
- Spark processes logs in micro-batches, optimizing throughput
- S3 writes are batched for efficiency
Query Performance:
- Athena uses columnar Parquet format for fast queries
- Partitioned storage (by service, year, month, day, hour, minute) enables partition pruning
- Glue manages metadata for efficient query planning
Performance Characteristics:
- Ingestion: Vector can handle 100K+ events/second per instance
- Processing: Spark can process millions of logs per minute with appropriate worker count
- Query: Athena queries typically complete in seconds to minutes depending on data volume
5. Reliability & Data Integrity
Requirement: System must ensure data is not lost and processing is consistent.
How It's Achieved:
End-to-End Reliability:
- At-Least-Once Processing: Kafka ensures messages are delivered at least once. Spark handles idempotent processing.
- Checkpointing: Spark checkpoints processing state, enabling exactly-once semantics for critical operations.
- S3 Durability: Once written to S3, data is never lost (11 nines durability).
Monitoring & Alerting:
- Orchestrator tracks log sync delays to detect processing issues
- Health check endpoints provide real-time system status
- Pipeline health API (
/pipeline/health) checks all components
Data Validation:
- Vector validates and enriches log data
- Spark validates data before writing to S3
- Glue schema enforcement ensures data quality
6. Maintainability & Observability
Requirement: System must be easy to monitor, debug, and maintain.
How It's Achieved:
Centralized Monitoring:
- Grafana dashboards provide visibility into log processing, system health, and business metrics
- Orchestrator exposes metrics APIs for integration with monitoring systems
Automated Operations:
- Orchestrator automates Spark job management, eliminating manual intervention
- Auto-scaling reduces manual capacity planning
- Automated retention policies manage storage lifecycle
Health Checks: All components expose health endpoints:
- Orchestrator:
/healthcheck,/pipeline/health - Vector: API health endpoint
- Spark: Master API for job status
- Kafka: Broker health metrics
- Orchestrator:
Logging & Debugging:
- All components log to standard outputs
- Orchestrator maintains job history in database
7. Security
Requirement: System must protect data and control access.
How It's Achieved:
Network Security:
- Load balancers can be configured with SSL/TLS termination
- Components communicate over private networks where possible
- Security groups restrict access to necessary ports only
Access Control:
- IAM roles for AWS services (S3, Athena, Glue)
- Database access controlled via credentials and network policies
- Grafana supports authentication and authorization
Data Protection:
- S3 supports encryption at rest
- Kafka can be configured with SSL/TLS for encryption in transit
- Database encryption at rest (RDS)